Green Building Facts
The value of green building construction starts is expected to exceed $12 billion in 2007.(Source: McGraw-Hill Construction Analytics)
The construction market accounts for 14.2% of the $10 trillion U.S. GDP.
(Source: 2006 DOE Buildings Energy Databook).
U.S. Green Building Council Membership
- 11,267 member organizations, including corporations, governmental agencies, nonprofits and others from throughout the industry
- 91,000 actively engaged individuals
- Since 2000, USGBC's membership has increased ten-fold
LEED® Green Building Rating System™
- LEED for new construction was first released in 2000
- LEED became available for commercial interiors/tenant improvements and existing buildings/operation and maintenance in 2004; LEED for core & shell became available in July 2006; LEED for homes and LEED for neighborhood development are currently in pilot test
- Square feet of commercial building space registered or certified: 4 billion
| LEED Registered Projects | Certified Projects | |
| New Construction | 5,294 | 787 |
| Commercial Interiors | 716 | 166 |
| Existing Buildings | 505 | 58 |
| Core & Shell | 981 | 47 |
| Neighborhood Development | 238 | |
| Schools | 63 | |
| Retail | 46 | |
| Total | 7,843 | 1,004 |
- There are LEED projects in all 50 states and 41 countries
- Owners of LEED-registered and certified projects represent a diverse crosssection of the industry
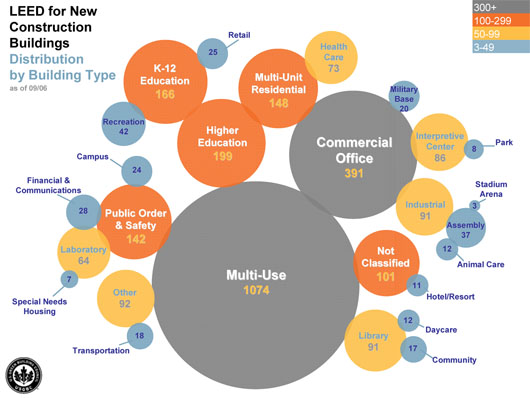
- Project types of all LEED-registered and certified projects by square footage:

Education & Accreditation
- LEED workshop attendance: 56,011
- LEED Accredited Professionals: 39,636
- Greenbuild Attendees 2006: 13,382
Size and Impact of the U.S. Built Environment
U.S. Construction market in 2001 (includes all commercial, residential, industrial)- Represents 20% of U.S. economy
Source: National Institute of Standards and Technology and the National science and Technology Council: Construction Industry Statistics, 1995 - Comprises 14.2% of the $10 trillion U.S. GDP. This includes all commercial, residential, industrial and infrastructure construction. Commercial and residential building construction constitutes 9% of the GDP.
Source: 2006 U.S. DOE Buildings Energy Databook
Energy Consumption
- Buildings represent 39% of U.S. primary energy use (includes fuel input for production)
Source: 2003 U.S. DOE Buildings Energy Databook.
Electricity Consumption
- Buildings represent 70% of U.S consumption
Source: 2003 U.S. DOE Buildings Energy Databook
Water Use
- Buildings use 12.2% of all potable water, or 15 trillion gallons per year
Source: U.S. Geological Service, 1995 data.
Materials Use
- Buildings use 40% of raw materials globally (3 billion tons annually)
Source: Lenssen and Roodman, 1995, "Worldwatch Paper 124: A Building Revolution: How Ecology and Health Concerns are Transforming Construction," Worldwatch Institute.
Waste
- The EPA estimates that 136 million tons of building-related construction and demolition (C&D) debris was generated in the U.S. in a single year.
Source: U.S. EPA Characterization of Construction and Demolition Debris in the United States, 1997 Update. - Compare that to 209.7 million tons of municipal solid waste generated in the same year.
Source: U.S. EPA Characterization of Municipal Solid Waste in the United States, 1997 Update. Report No. EPA530-R-98-007
Information provided by the U.S. Green Building Council.


